Technical analysis for iPhone
Turn any financial chart into structured technical insight.
Upload a chart screenshot and understand the trend, key levels, momentum, patterns and bull and bear scenarios — in plain language.
Coming soon to the App Store
Includes free analyses. DB Chart Pro starts with a 7-day free trial for eligible new subscribers.
How it works
Screenshot. Analyse. Understand.
Take the chart you are already looking at and get a structured read of it, with the evidence behind every call.
-
Capture
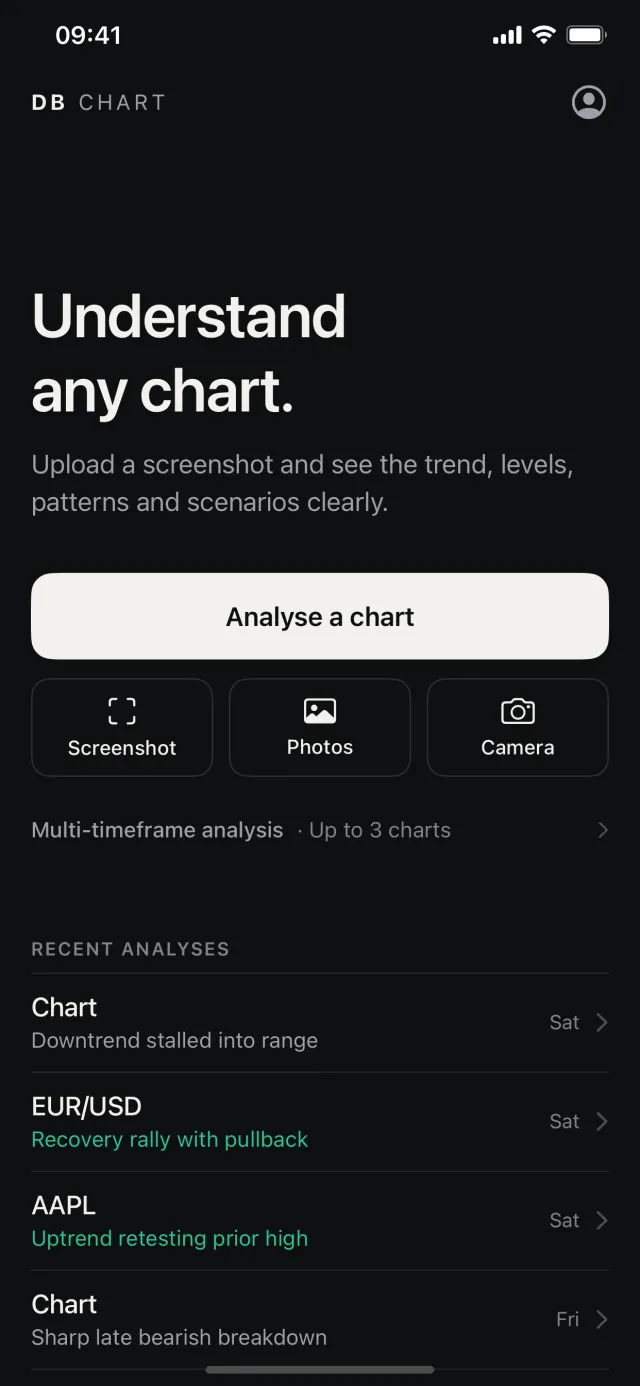
Screenshot a chart from any app or site, pick one from Photos, or use the camera.
-
Analyse
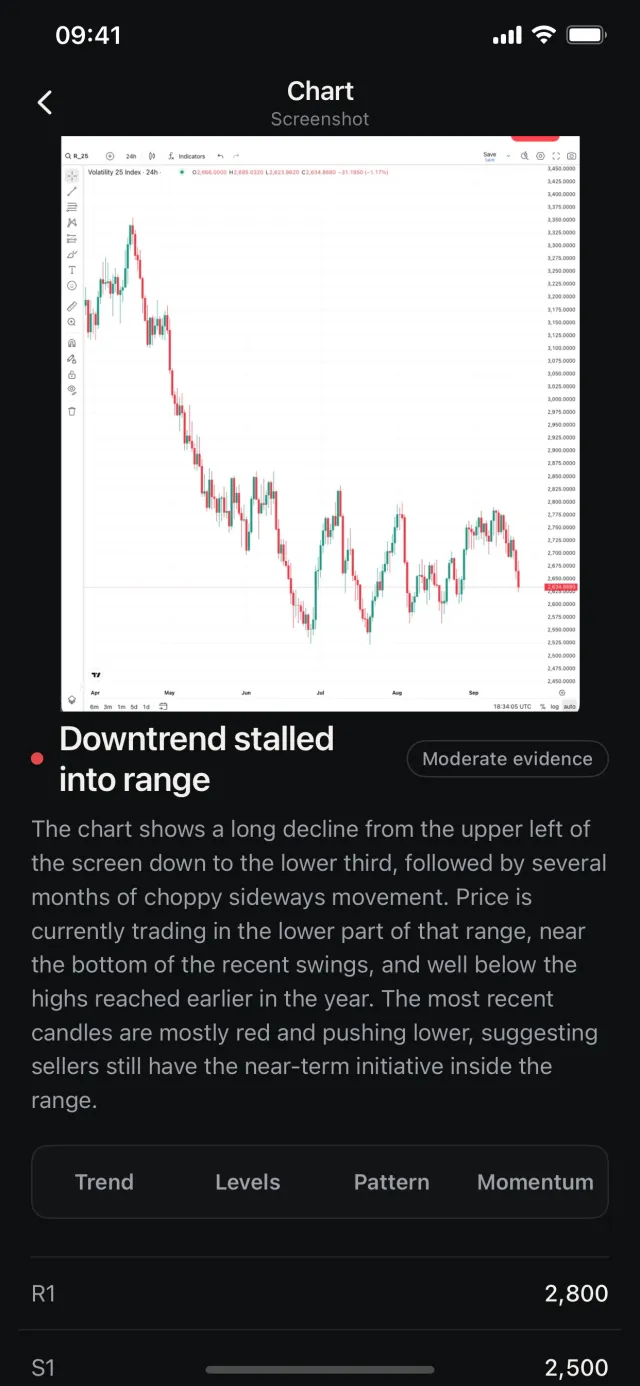
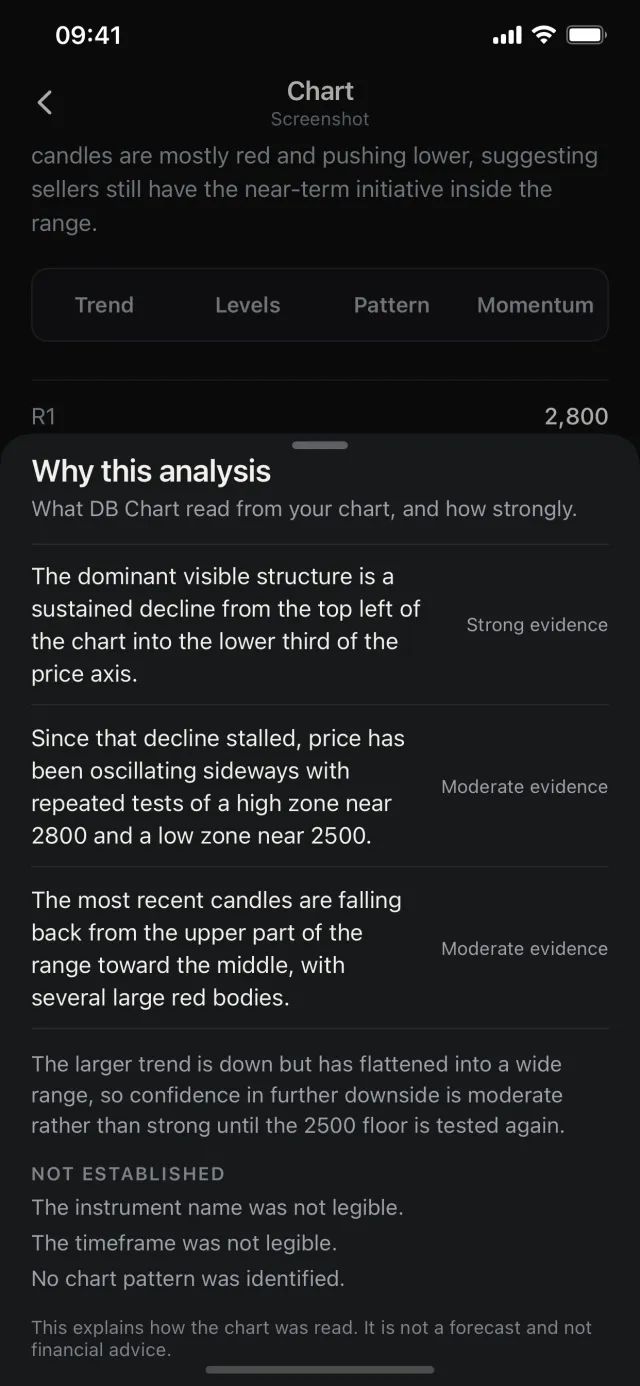
DB Chart reads the structure and rates how strongly each observation is supported, including what it could not establish.
-
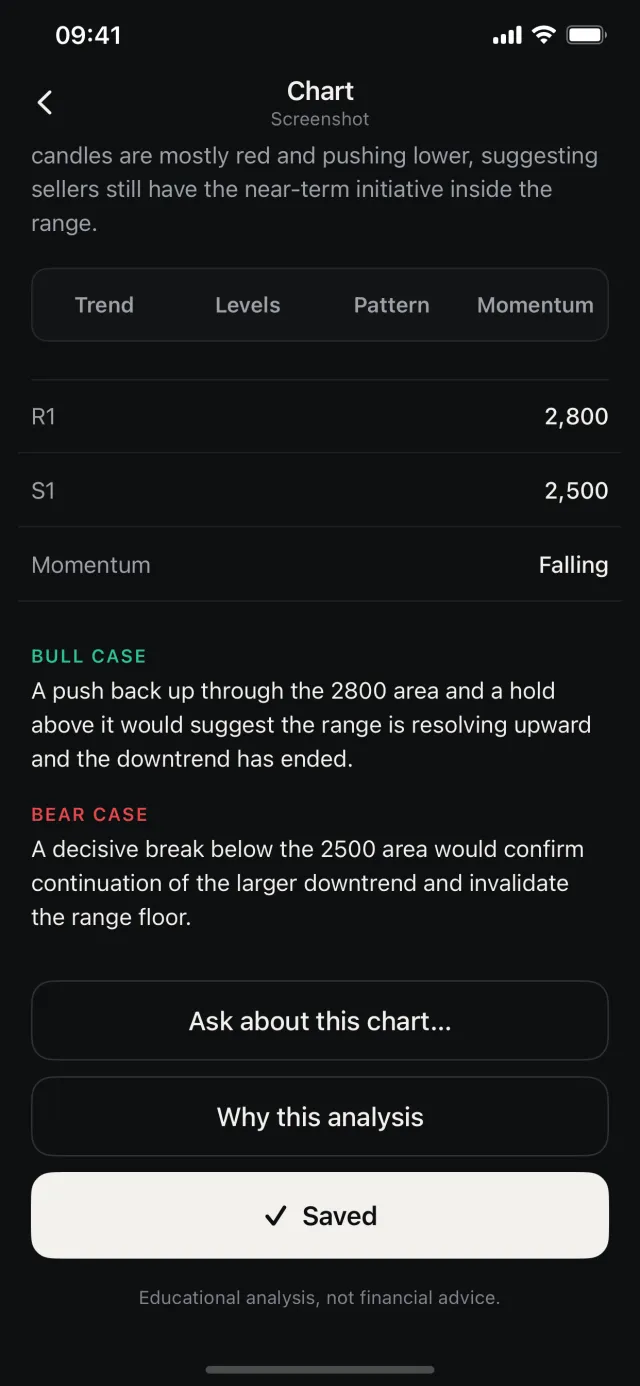
Understand
Key levels, momentum, and a bull and a bear case, each tied to the price that would confirm it.
What it does
-
Reads a chart screenshot
Take a screenshot from any charting app or site, or use a photo. DB Chart works out the structure and explains what it sees.
-
Names the levels that matter
Support and resistance are listed with the prices they sit at, formatted for the instrument.
-
Sets out both cases
A bull case and a bear case, each with the condition that would confirm it, so the reasoning is visible.
-
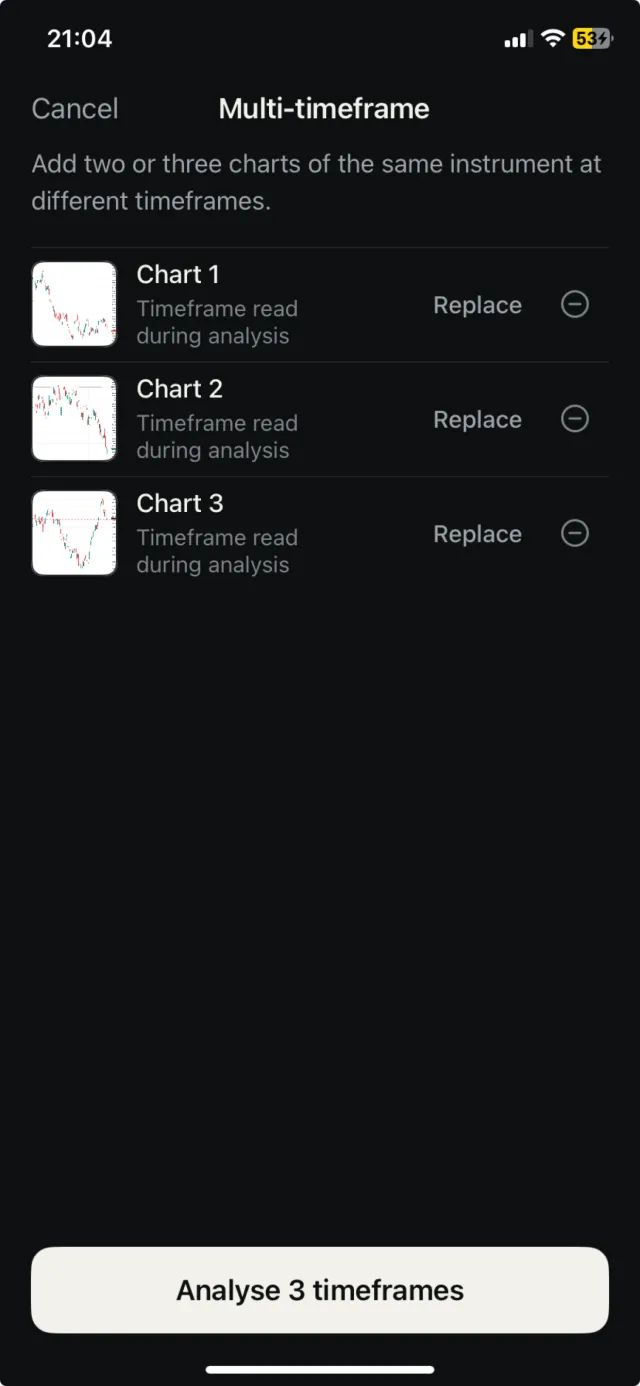
Compares timeframes
Add two or three charts of the same instrument and see where the timeframes agree and where they conflict.
-
Answers follow-up questions
Ask about any analysis and get a short, direct answer grounded in that chart.
-
Shows its evidence
Every analysis carries an evidence rating and the observations behind it, so you can judge how much weight it deserves.
Multi-timeframe
One instrument, up to three timeframes, one conclusion.
Add two or three charts of the same instrument and see where the timeframes agree and where they conflict — read together, rather than as three separate reports.
- Resistance 2,700 · 2,790
- Support 2,620 · 2,550
- Evidence Moderate
From DB Chart's analysis of the three Volatility 25 Index charts shown: 24h, 2h and 1m.
Built to make charts easier to read
From a screenshot to structured technical context — without adding more clutter to your workflow.
-
Take a screenshot from any charting app or snap a photo, and get a structured read of what the chart shows.
Screenshot analysis -
See the prevailing direction described in plain language, including where a trend has stalled or turned.
Trend -
Support and resistance are pulled out as specific prices, formatted for the instrument you are looking at.
Key levels -
A momentum read with the reason behind it, grounded in what the recent candles show.
Momentum -
Chart patterns are named when the structure supports one — and when none is clear, it says so.
Patterns -
A bull case and a bear case, each tied to the price that would confirm it.
Bull and bear cases -
Compare two or three timeframes of one instrument and see where they agree and where they conflict.
Multi-timeframe
DB Chart Pro
Try it first. Subscribe if it earns it.
A few analyses are included so you can see what it does first. DB Chart Pro then keeps them coming, starting with a 7-day free trial for eligible new subscribers. Weekly and monthly plans are available; prices are shown in the App Store for your region.
Subscriptions renew automatically unless cancelled at least 24 hours before the end of the current period, and are managed in your Apple account settings.
Coming soon to the App Store
DB Chart is an educational tool for reading charts. It does not provide financial, investment or trading advice, does not execute trades, and makes no claim or prediction about future prices or returns. Always do your own research.